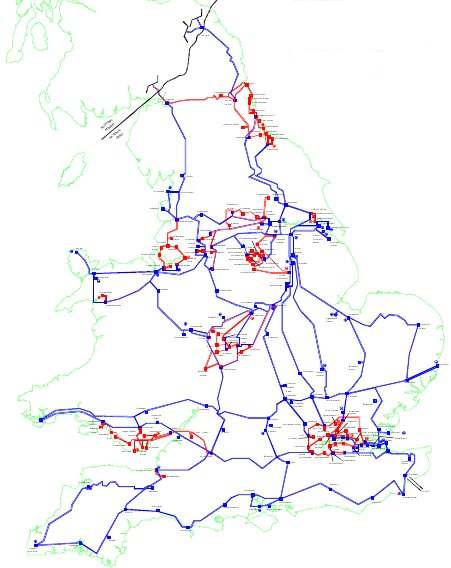
`National Grid', the UK electric transmission system operator, publishes details about its system's network and loading. This is interesting even just `for fun' to get an idea of the system parameters, and it's particularly handy for people needing some realistic system data for testing their ideas about load-flows, changes in generation siting, reliability etc.
The available data is only about the network and
about basics of the connected capacity. (I.e. it is not that
holy grail, the complete network, with dynamic models of all
significant connected equipment, along with loads of data on
actual disturbances, operating conditions and time-development,
that would permit a full transient analysis by a method of
our choosing, and comparison with the real results.)
This is perhaps in part because the network operator isn't responsible
for the generators.
The system in Scotland has always been
distinct, but now (valid:2008) the same company operates the
Scottish transmission system as well as the England and Wales
system, making the data more thoroughly `GB' (Britain). The
term `UK' is often applied, which should include Northern Ireland;
that system is operated separately, but with a DC interconnector.
In the back of the Seven Year Statements (under `Electricity' on the `National Grid' homepage) there are sets of network data; recently, these have also become available as `online downloads' in forms more useful than PDF for automatic input to calculation programs.
As a rather fun extra, the instantaneous demand, interconnector
power, and frequency, can be seen on the web, along with hour
and day charts: e.g. 1-hour
Demand and
Frequency.
Or, you might prefer my plots of frequency, load and flows for the last 24h period,
last week and last month. The (quarter-hourly) data can be a little jumpy sometimes,
when the source website doesn't update things, but it's still quite interesting to see:
uk_ng_last_month.pdf,
uk_ng_last_week.pdf,
uk_ng_last_24h.pdf.
The source data and scripts for getting and plotting it are
here.
The following are notes I made on data from the 2007 annual report, just to get a reminder of the sorts of powers, impedances, short-circuit currents, etc. involved. Rather than fool around putting them into html, I'll just have them as text.
Note some terminology (not all from the previously referenced annual reports and seven-year statements).
[All per-unit (pu) values are to bases of 100 MVA on the rated voltage.]

Minimum demand was 25.4 GW (? -- GVA?)
Maximum demand was 62.0 GW.

Losses (at peak demand?) were 1.3 GW, ~2.2% of the ~60 GW demand.
Of this,
	780 MW was transmission heating,
	125 MW GSP (grid supply point: `load-bus') transformer heating,
	128 MW generator transformer heating,
	272 MW fixed losses (presumably system equipment power, corona, and
          perhaps transformer iron loss if not included as 'transformer heating').

Shunt reactive compensation uses several device-types:
    MSC (mechanically switched capacitor),
    SVC (thyristor-controlled inductor, shunting capacitor)
    Synchronous compensator (synchronous machine)
    Reactor (reactive sink)
The total reactive power generation/absorbtion at each voltage is:
	voltage         generate-MVAr   absorb-MVAr
	400             5850            2600
	275             2100            2080
	132             5844            4050
	 66              120               0
There are 4 SVCs:
	2 at 275 kV and 1 at 400 kV,
		generating    150 MVAr
		absorbing 75--105 MVAr,
	1 at 132 kV,
		generating 60 MVAr
		absorbing   0 MVAr

Quad-boosters: 9 of them (4 at 400kV, 5 at 275kV),
all with +-20% tap-range (which affects %X).
	400 kV -->     ~2000 MVA & ~7--15 %X
	275 kV -->      ~750 MVA & ~5--9  %X
	Keadby is special! 2750 MVA with  11--15 %X.

Connected generation.
(The meaning of `units' isn't obvious: it seems that e.g. AGR stations
with pairs of reactors, generators etc. are regarded as single units,
as of course are big collections of wind generators.)
	Coal:           28900 MW,      17 units,
	Gas turbine:    26100 MW,      47 units,  (41 CCGT, 6 OCGT)
	Nuclear:        11000 MW,      12 units,  (4 Magnox, 7 AGR, 1 PWR)
	Oil:             3496 MW,       3 units,
	CHP (gas?):      1741 MW,      12 units,
	Hydro:           1028 MW,      34 units,
	Wind:            1737 MW,      37 units,
	Pumped storage:  2300 MW,       4 units,
	        Total: ~76300 MW from 166 units.

Interconnections:
	France:         2000 MW, normally importing.
	Holland:        1320 MW, normally importing, in operation from year ~2010.
	N.Ireland:       500 MW, normally exporting (can import 80 MW)

Typical transformer ratings:
	Autotransformers binding 400 and 275 kV sections:
        	500--1000 MVA, 12--20 %X on rating
		(i.e. <=2% on system's 100 MVA base)
	SGT (from 400 or 275 kV to lower levels)
	        120--240 MVA, 15--24 %X on rating
Most transformers' seasonal ratings don't vary at all, others slightly (few %).
Interesting that a few transformers have positive (i.e. capacitive)
shunt susceptance; is this real? Can some perhaps have so low a magnetising
current that the capacitance of the windings gives a dominant current?

Short circuit levels:
400 kV levels range from
	10 -- 150 kA initial peak (10 is an outlier; 25 is next)
 	10 --  55 kA rms breaking current.
	Initial/Breaking peak ratio is about 1.4.
	rms/dc breaking ratio is about 1.4.
These 400 kV short-circuit currents are about 50% more than on the 275 kV buses.
1ph and 3ph currents are similar to each other (few|ten %).
Supply points (at the 132 or 66 or 22 kV side) have lower values.

The network has lengths of about:
	branch type,		total km,     max km in one branch
	400 kV line:		9000		146
	275 kV line:		2000		 52
	400 kV cable:		 100		 22
	275 kV cable:		 300		 20
	(taken from pure lines or cables, not from the composites).

Overhead line (OHL) and underground cable (UGC) ratings are seasonally
dependent, rated lowest in summer and highest in winter. The seasonal
variation is mainly less than 20%, and in some cases is zero. Ratings
vary surprisingly much between different branches of the same type and
voltage level, particularly for 400 kV OHL.
Perhaps they are not just based on physical line constraints of the line
but also on more system-oriented constraints, e.g. sharing or stability.
Between all the different branches and season ratings:
	400 kV line ranges from  1000 to 3500 MVA.
	275 kV line ranges from   500 to 1500 MVA.
	400 kV cable ranges from 1000 to 1800 MVA.
	275 kV cable ranges from  200 to 1100 MVA.

Characteristic impedance (Z0) is about
	250--300 ohm for OHL, and
	  30--40 ohm for UGC.

Propagation velocity as a fraction of free-space value is
	~1 for OHL and 1/4 for UGC,
but this is very rough as the input data is per-phase values
of a three-phase line, so the more relevant figure of
propagation of a disturbance (e.g. PD signal?) along a single
coaxial phase/earth cable then the L and C are different.

Per-km transmission line parameters are in the order of:
	R: tens of milliohms
	    (~30 mOhm for line, approx half as much for cable).
	L: millihenries
	    (~1 mH for line, approx half as much for cable, wL = X =~ 10*R)
	C: nano/micro farads
	    (10 nF for line, 350 nF for cable: big big difference)

SIL (surge impedance loading, natural loading): order of ten times as much for
    cables as for lines; lines operate generally above SIL, cables below.

Some *averaged* branch parameters from the 2001 annual report (processed by 'ngcpst'):
	Property:    Z0%    Z0       SIL(MVA)  R%     X%     B%      R mOhm  L mH   C uF
	400kV OHL    0.17   268.42    600      0.001  0.018  0.638   23.64   0.91   0.01
	400kV UGC    0.02    36.20   4500      0.001  0.009 17.459   14.70   0.46   0.35
	275kV OHL    0.38   285.61    270      0.005  0.041  0.290   37.22   0.98   0.01
	275kV UGC    0.05    38.16   2000      0.003  0.022  9.250   22.83   0.54   0.39

Power loss due to series resistive heating for 1GW transfer over 1000km,
NOT including extra reactive flow due to 1GW != SIL:
	400 kV OHL:   9 --  20% (mean 15%)
	400 kV UGC:   7 --  10% (mean 9%)
	275 kV OHL:  23 -- 100% (mean 46%)
	275 kV UGC:  10 --  92% (mean 31%)
(Note: this loss estimation is an unrealistic use of the uncompensated line,
       but is done just to get an idea of what sort of transmission losses
       must be involved in long-distance transmission. The range and mean
       refer to values for different line or cable parameters given in the
       system data.)
In case anyone's interested, my old collections of 2001 network data, and (matlab/octave?) scripts to do interactive investigation of the network, are here: ngc_calcs.
Do let me know of any other such information, for other systems,
or particularly of good dynamic data freely available for significantly
sized real systems.
[an error occurred while processing this directive]
Page started: 2008-10-06
Last change: 2011-11-21